A simple and cost-effective solution for an NHS Trust developed for our partners at Ethical Healthcare Consulting.
Example project
This contains sample data and branding has been removed.
Note some example features
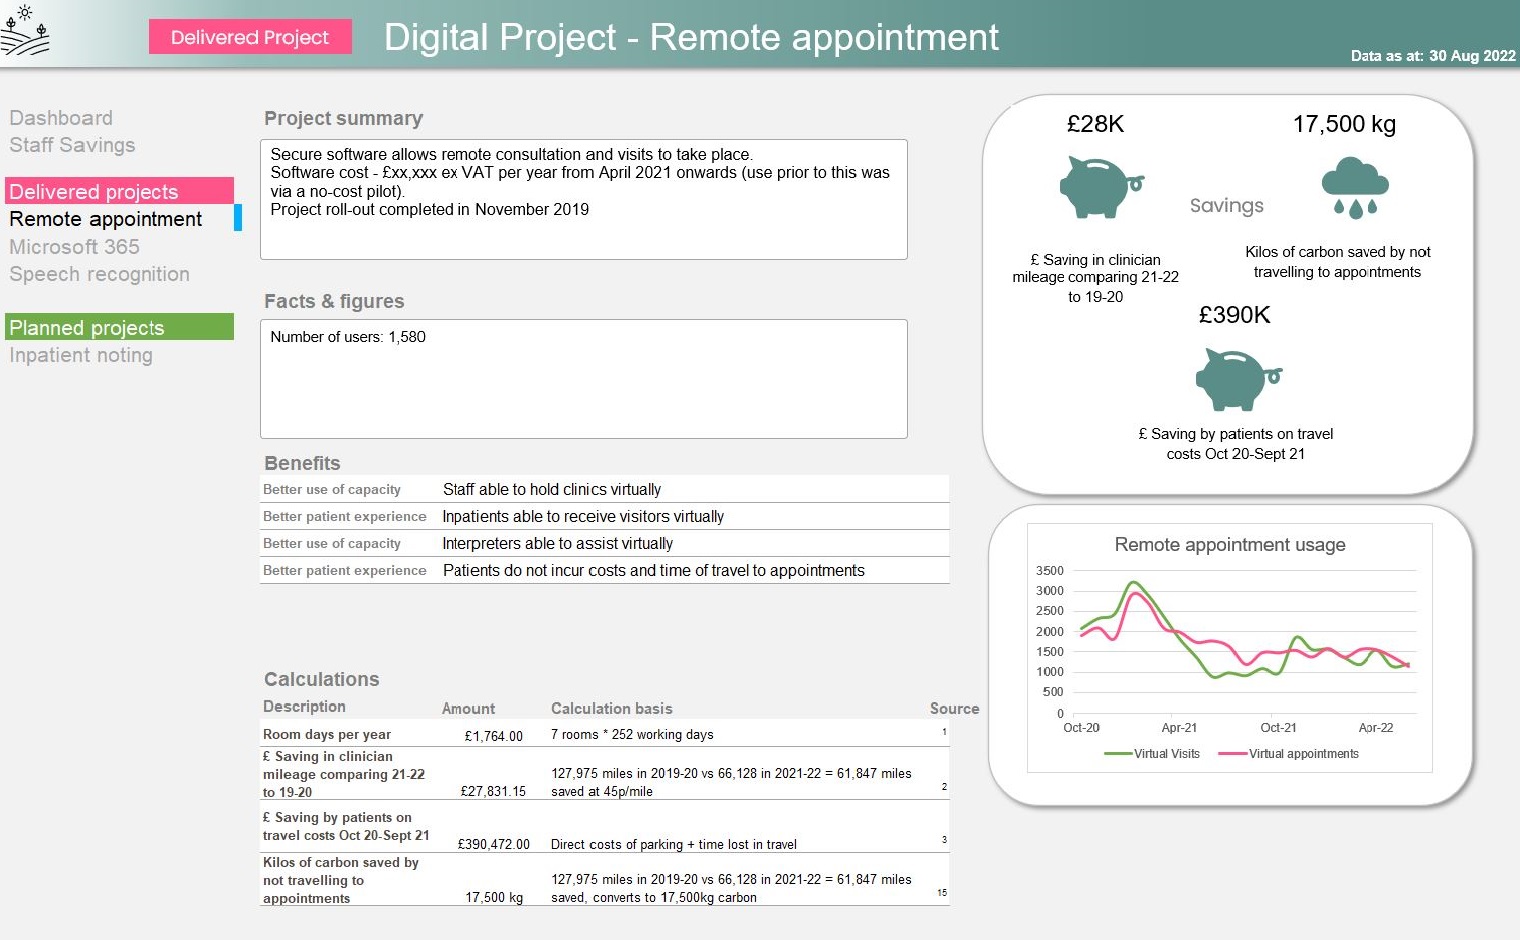
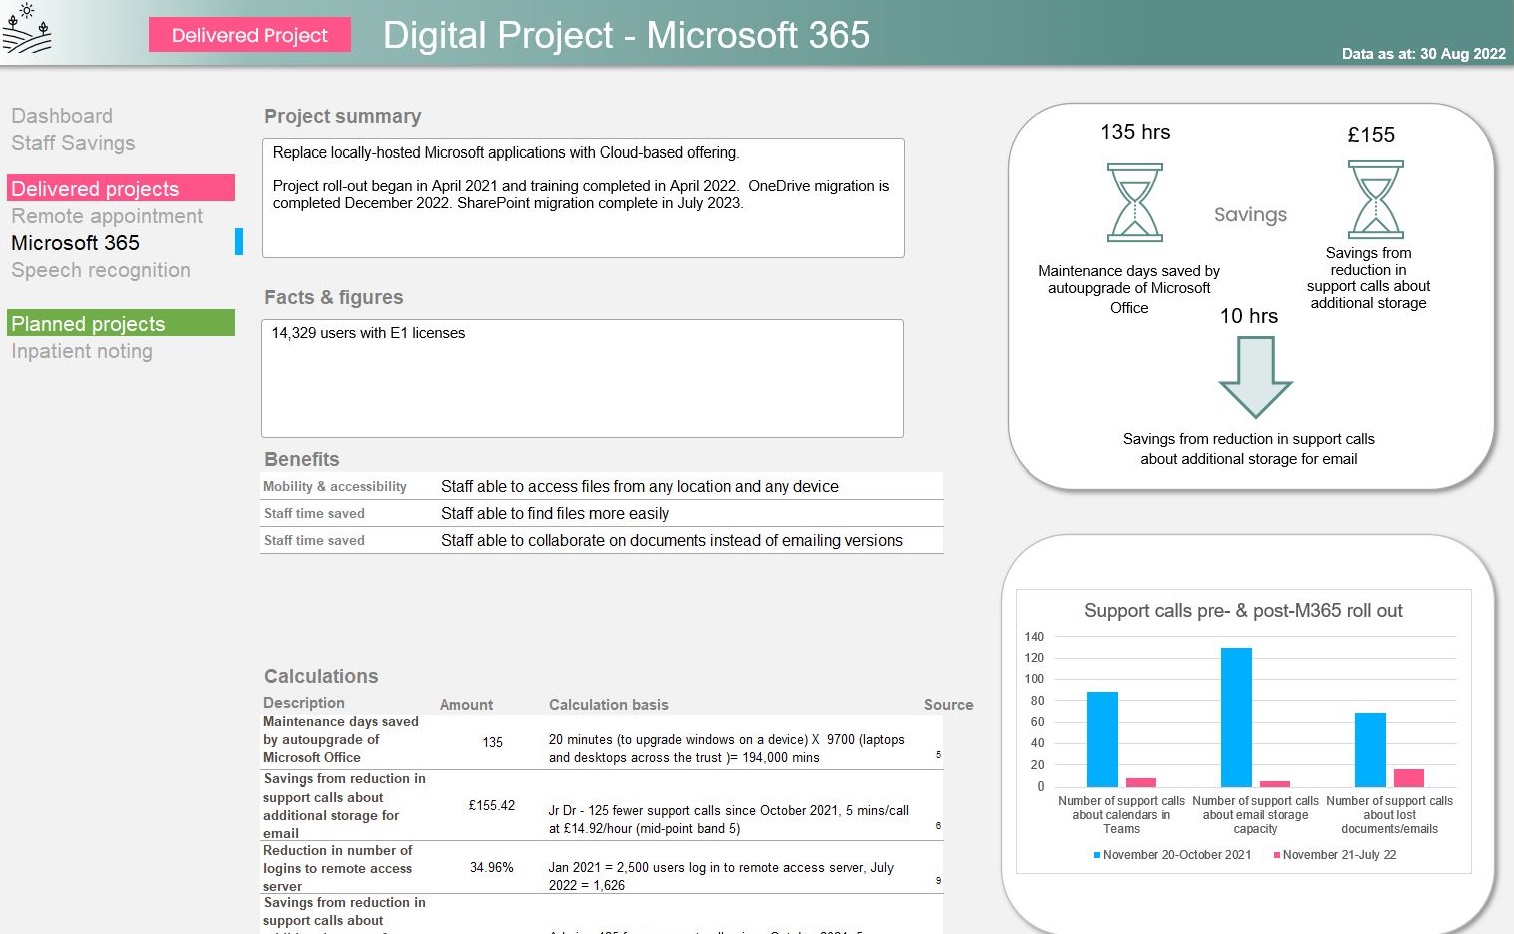
App-like navigation menu, data currency indication.
Aptemus’ work often involves data analysis and visualisation on Microsoft’s Power Platform in the Cloud, but sometimes good old Excel is what our customer needs.
This was the case with a digital team in a large NHS Trust on the south coast. They had a wealth of benefits information and needed a new way to showcase it - to display a portfolio of projects which their stakeholders could review at a glance. They needed something which, once built, was easy for them to maintain, and which didn’t require any special licensing or additional tech. Something which could look good but also could be emailed if required.
Making use of Excel 365’s array formulas
Working closely with the team at Ethical and the Trust’s Benefits team, we developed a data-driven dashboard in Excel, utilising many of Excel’s latest array formulas to allow for the flexible presentation of data and the creation of an ‘app like’ look and feel, with a navigation menu and advanced styling. Conditional formatting ensures the sections of the page containing data stand out from the background in a dynamic way.
We created an Excel theme so that the charts and other visualisations would automatically be displayed in the team’s corporate colour palette. We provided a data section with dynamic lists of values to ensure smooth and intuitive data entry, and made it possible to add another project to the portfolio and configure it for display in under 10 minutes.
The navigation menu is also completely data-driven, allowing the Benefits team to update the dashboard navigation without needed to understand any of the underlying formulas.
The dashboard brings together data from across multiple projects, calculating total time, carbon and cost savings for the Trust. As projects are added and benefits amended, these totals automatically update to reflect the latest position.
Why use Excel?
As I discussed at my recent talk at the Microsoft 365 North user group, although Power BI offers many advantages over Excel, it does have a number of disadvantages too.
- The licensing cost is the most obvious - this will normally be an unwelcome outlay.
- The sign-up process for Power BI is cumbersome and includes a request for a phone number - not very reassuring
- It feels like ‘another tool to learn’, another URL to have to bookmark. It doesn’t feel as if it is at the fingertips of a busy executive.
- Data ingestion is not as straight forward - yes, end users can drop files into a SharePoint folder and have them automatically ingested but they can’t immediately see how new data will affect the dashboard.
Of course, there are lots of limitations to Excel as well!
- Whilst having two developers working on a single Power BI dataset can be tricky, it’s harder with Excel. In both cases, a good architecture will help to separate the data processing from the data presentation.
- Excel lacks some of the ‘killer features’ of Power BI, like cross-filtering.
- Excel Online doesn’t always respect formatting, particularly row heights, and doesn’t like linked pictures.
- Working within the confines of a grid system can make layout hard.
- Your users can take their own copy of the dashboard and opt not to refresh it from the data source.
Be guided by what will work best for your users
An Excel-based dashboard may be a great tool to make the case for further investment in analytics. Or it might be just enough for what the customer needs.